
Statute is the authorization document. Review the statute to identify how it:
- Names the purpose
- Defines the scope and limits
- Establishes stewardship obligations
Then review the current mission statement:
- How does the mission statement reflect statutory purpose?
- What specific commitments does the statute make that the mission statement carries forward?
- How do the statute and mission statement together point toward quantifiable outcomes for the public?
- Statute grounds the definition of public value in what citizens, through Congress, have specified the organization to deliver
- Reading the statute and mission statement together surfaces the full scope of what the organization has committed to deliver — and points toward where the work of translation begins
| Source | What it authorizes |
|---|---|
| U.S. Constitution, Art. I §2 Cl. 3 | Enumerate the population every 10 years as the basis for Congressional apportionment |
| Title 13 U.S.C. | Collect, compile, and publish statistics on people and economy |
| Title 13 §11 | “There is authorized to be appropriated, out of the Treasury of the United States, such sums as may be necessary to carry out all provisions of this title.” — stewardship obligation embedded in statute |
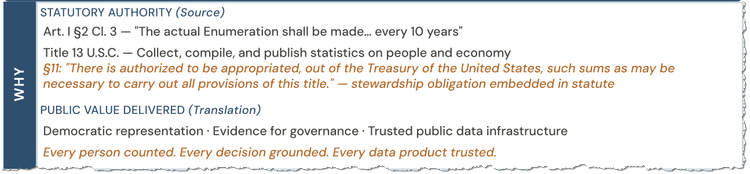
Anchor Mission to Public Value canvas · WHY row · Census Bureau example
For each domain of work the organization performs, identify:
- What are the core services we provide to fulfill our mission?
- What are the needs that trigger each service?
- What are the resulting outcomes?
- Think in terms of jobs to be done, not touchpoints or service channels
- Contact centers, websites, and publications are interaction channels — they describe how the organization delivers, not what it delivers or why
- The need that triggers the service and the outcome it produces are what belong here
- Distinguish between means and ends: a passport is a physical artifact; the outcome it delivers is freedom of movement, proof of citizenship, and border security — name the outcome, not the artifact
- Apply the same discipline to data: ask whether the activity names what the organization does (disseminates) or what the customer achieves (accesses and uses) — the customer perspective belongs in the outcome column
- After completing WHAT, continue to WHO — customer identification often surfaces additional core services not yet visible from the activity perspective
| Core Activity | Need that triggers it | Resulting outcome |
|---|---|---|
| Decennial Enumeration | Constitutional requirement to count every person | Accurate population count as basis for apportionment and federal funding |
| American Community Survey | Ongoing need for demographic and economic data | Continuous data for community planning and program decisions |
| Economic Censuses | Need for comprehensive business and economic statistics | Foundation data for GDP and economic policy, every 5 years |
| Data Access and Use | Need to make all data products available and usable across user types | Informed decisions, evidence-based governance, trusted public data infrastructure |
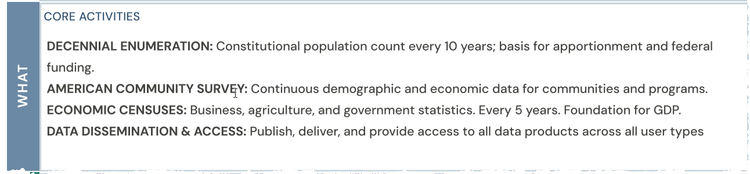
Anchor Mission to Public Value canvas · WHAT row · Census Bureau example
For each core activity identified in WHAT, identify:
- Who are the direct recipients or beneficiaries of this service?
- Who contributes to or enables delivery of this service?
- Who provides oversight, sets conditions, or holds the organization accountable for results?
- Use the Customer Roles Framework to structure this analysis — it organizes customers and stakeholders into three categories: Consumers, Producers, and Approvers
- Consumers are those who receive or use the service — end users, beneficiaries, and intermediaries who interact on their behalf
- Producers are those whose capabilities enable delivery — employees, partners, suppliers, and data contributors
- Approvers are those who shape delivery conditions and outcome criteria — Congress, oversight bodies, and regulatory authorities
- Different customer roles have different needs, different measures of success, and different definitions of value — map them separately
- Some participants appear in more than one role — a survey respondent is both a Consumer (of the survey design and process) and a Producer (of the data the mission depends on)
- After completing WHO, return to WHAT — customer identification often surfaces core services not yet visible from the activity perspective
| Customer Role | Who they are | What they need |
|---|---|---|
| Consumers — End Users | Federal, state, and local agencies; researchers; businesses; journalists; general public | Accurate, timely, accessible data products for decisions and programs |
| Consumers — Intermediaries | State data centers; academic institutions; data repackagers | Data in formats that enable further analysis and redistribution |
| Producers — Internal | Census employees, field representatives | Clear methodology, systems, and authority to collect and process data |
| Producers — External | Survey respondents; federal agency data suppliers; national and local partners | Simple, low-burden participation; understanding of how their data is used |
| Approvers | Congress; OMB; OIG; CNSTAT; GAO; Secretary of Commerce | Compliance with statutory scope, methodology standards, and stewardship obligations |
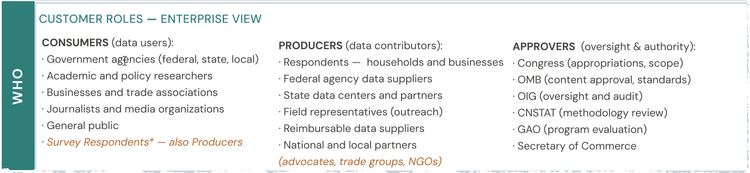
Customer Roles Framework · Census Bureau example
For each core activity identified in WHAT, map the stages of the service journey from the Consumer’s perspective:
- What triggers the consumer’s interaction with the organization?
- What are the core stages the consumer moves through from trigger to outcome?
- What products and services does the organization provide at each stage to co-create value?
- Map the stages from the Consumer’s perspective — the sequence reflects what the customer experiences, and the organization’s role at each stage
- Different consumer segments experience different stages — map each segment separately where journeys diverge
- A stage that fewer customers reach carries equal importance — stages reached by fewer customers often carry the greatest statutory weight
- Products and services are what the organization provides at each stage to enable the consumer to move forward — name them specifically
- After completing HOW, return to WHO — stage mapping often reveals consumer roles or segments not visible in the initial customer identification
Census has two distinct consumer journeys corresponding to two core activities. Each is mapped separately.
| Stage | What the consumer does | What the organization provides |
|---|---|---|
| Receive | Receives survey notification | Survey instrument, instructions, contact information |
| Understand | Reviews questions and purpose | Plain language design, multilingual support |
| Respond | Completes and submits survey | Online, paper, and in-person response modes |
| Confirm | Confirms submission | Acknowledgment, non-response follow-up resolution |
| Stage | What the consumer does | What the organization provides |
|---|---|---|
| Identify | Identifies data need | Data catalog, topic guides, user support |
| Access | Locates and retrieves data | data.census.gov, APIs, microdata, publications |
| Use | Applies data to decisions or programs | Documentation, methodology notes, user tools |
| Repackage | Transforms and redistributes data | Licensed microdata, reimbursable survey products |
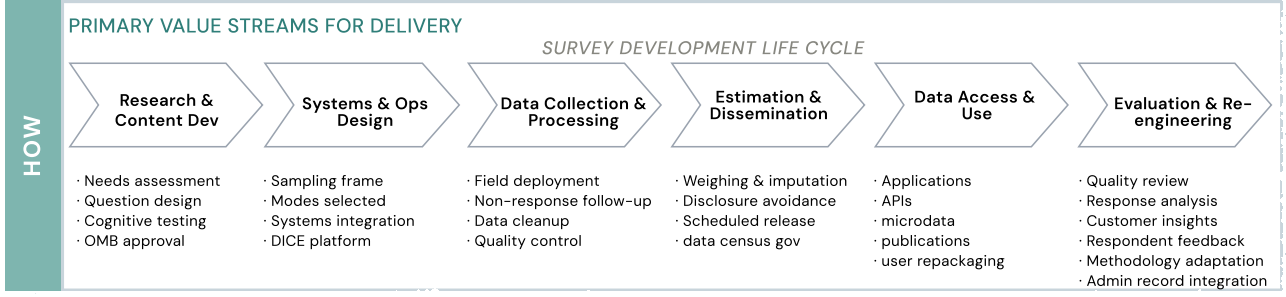
Anchor Mission to Public Value canvas · HOW row · Census Bureau example
Journey 1 — Standard Taxpayer: Prepare → File → Reconcile
Journey 2 — Complex or Questioned Return: Prepare → File → Respond → Examine → Appeal
HOW WELL is answered at three levels, corresponding to the work done in WHY, WHAT, and HOW. In the Anchor Mission to Public Value canvas, the measures for each level appear in the right column alongside the corresponding row.
- Mission outcome measures — does the organization deliver on the statutory purpose?
- Core activity measures — does each service area produce the outcomes it exists to generate?
- Service journey measures — does each consumer stage deliver the value the customer expects and the mission requires?
For each level, identify:
- What evidence would confirm this organization is delivering?
- What would a citizen shareholder recognize as proof that their investment is working?
- What measures already exist, and what gaps remain?
- Measures of value go beyond counts of activity and throughput — volume describes how much was done, not whether it delivered the intended outcome
- For each service journey stage, consider the attributes of service that contribute to the customer’s overall experience of value:
- Ease — how simple is it for the customer to complete each stage?
- Clarity — are instructions, forms, and communications clear and understandable?
- Quality — do products and services meet the customer’s need accurately and completely?
- Timeliness — does the organization deliver within timeframes that work for the customer?
- Efficiency — does the organization steward taxpayer resources responsibly in delivering the service?
- Transparency — does the customer understand what is happening and why at each stage?
- Courtesy — does every interaction reflect respect for the customer’s time and circumstance?
- Security — does the organization protect customer data and privacy throughout?
- Equity — does the organization deliver consistent quality across all customer segments, including those hardest to reach?
- A measure that captures one dimension of delivery while leaving others unmeasured can produce a misleading picture of mission performance
- The strongest measures trace from statutory obligation to customer outcome — what did Congress authorize, what did the customer need, and did the delivery produce the result both required?
The following measures correspond to the right column of the Anchor Mission to Public Value canvas, organized by level.
| What we are measuring | Example measure |
|---|---|
| Enumeration completeness | Coverage error rate by population segment |
| Data quality | Public confidence in Census data quality |
| Democratic function | Congressional use of data for apportionment |
| Funding accuracy | Federal program funding allocation accuracy |
| Core activity | Example measures |
|---|---|
| Decennial Enumeration | Response rate by population segment; coverage error rate by geography |
| American Community Survey | Data accuracy and completeness; timeliness of release vs. published schedule |
| Economic Censuses | Response rate by business type; data product usage rates |
| Data Access and Use | Data product access rates; user satisfaction by consumer type |
| Service attribute | Example measure |
|---|---|
| Ease | Respondent burden in hours per response |
| Clarity | Cognitive testing outcomes; field representative escalation rate |
| Equity | Response rate by hard-to-count population segment |
| Security | Disclosure avoidance compliance rate (Title 13 §9) |
| Service attribute | Example measure |
|---|---|
| Quality | Data accuracy and completeness by survey and release |
| Timeliness | Release schedule adherence rate |
| Ease | API uptime and accessibility; data catalog usability ratings |
| Transparency | Methodology documentation completeness |
| What we are measuring | Example measure |
|---|---|
| Cost efficiency | Cost per data product published (Title 13 §11) |
| Schedule adherence | Data release schedule adherence rate |
| Systems performance | Systems cost per survey program |
The five steps in this guide are framed at the enterprise level — the full scope of what a mission organization exists to deliver. The same discipline applies at every level of the value stream, including the internal, backstage operations that make customer-facing delivery possible.
Consider a web page that explains how to obtain a passport. That page is a product. It supports a larger service — the passport application journey. It serves a specific consumer at a specific stage: a citizen who needs to understand what is required before they begin. If that page is incomplete, inaccurate, or difficult to understand, the consequences are measurable: more questions to contact centers, more errors in submitted applications, longer processing times, lower customer satisfaction with the overall journey.
Any team can apply the same five questions to the work they own:
This recursive quality is a feature of the methodology. Value is created and co-created at every level — from the statutory mission that authorizes the enterprise to the backstage team that builds the tool a front-stage team depends on. Gaps at any level propagate forward.
- Each step may surface something that prompts a return to a prior one — a customer identified in WHO that reveals a service missing from WHAT; a journey stage in HOW that points to a measure not yet named in HOW WELL
- That iteration is the work — the five questions provide the structure; the leadership team provides the answers
- Value is a much richer, more dynamic concept than cost — it involves human behavior, perception, and experience. Measures that count activity and throughput capture cost. Measures that trace from statutory purpose through customer outcome capture value.